| Transportation Hubs | 500,000–1,000,000 | 25–75 minutes | Weekdays, 7:00–10:00 and 16:00–20:00 | 6–12 | 6,000–12,000 | 1.2%–1.5% | Waiting areas, transfer corridors, food courts, and ticket halls | Very High | Large visitor volumes and waiting time create frequent urgent charging needs, while several access points support rapid station utilization. |
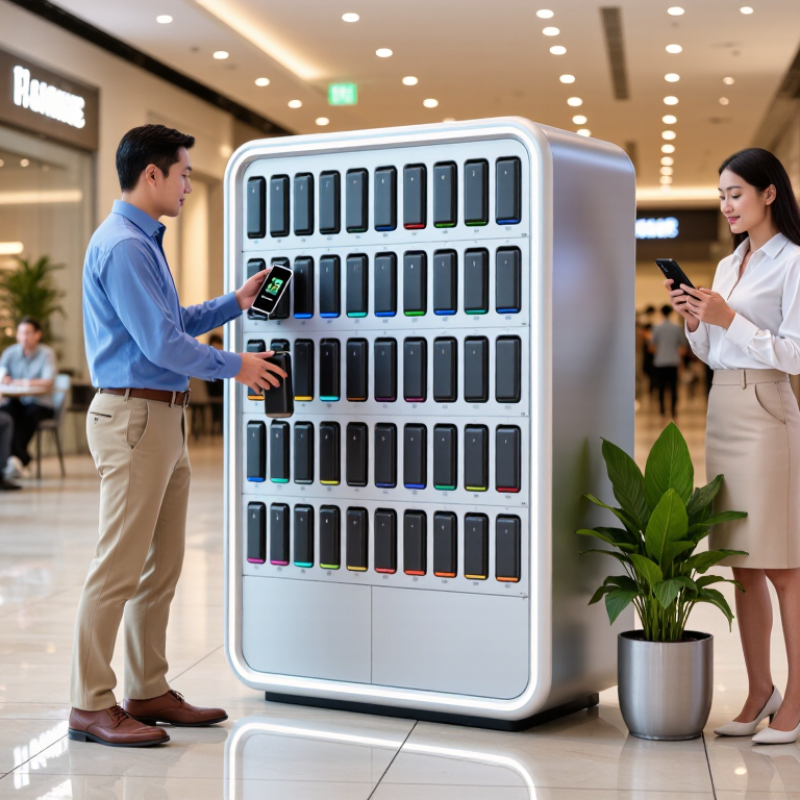
| Shopping Malls | 250,000–500,000 | 90–180 minutes | Friday evenings, weekends, and holidays | 4–8 | 7,500–13,000 | 2.5%–3.0% | Food courts, cinema entrances, central atriums, and customer-service areas | Very High | Long visits increase battery consumption from navigation, payments, social media, and entertainment applications. |
| Entertainment Districts | 50,000–150,000 | 120–240 minutes | Thursday–Saturday, 18:00–01:00 | 3–6 | 4,000–9,000 | 6.0%–8.0% | Restaurant clusters, venue entrances, nightlife corridors, and restroom areas | Very High | Extended evening visits and heavy smartphone use for communication, photography, payments, and ride-hailing drive strong demand. |
| Sports and Concert Venues | 40,000–120,000 | 150–240 minutes | Event days, typically 17:00–23:00 | 4–10 | 3,000–8,000 | 6.0%–7.0% | Entry gates, concourses, premium areas, and food-and-beverage zones | High | Concentrated visitor surges and long event durations can produce high rental volume, although utilization varies by event calendar. |
| Universities and Colleges | 25,000–60,000 | 120–360 minutes | Weekdays, 09:00–18:00 | 3–6 | 1,500–3,500 | 4.0%–6.0% | Libraries, student centers, cafeterias, and lecture-building entrances | Medium | Students spend long periods on campus and depend heavily on mobile devices, but demand is concentrated around academic terms and weekdays. |
| Hospitals and Medical Centers | 80,000–180,000 | 90–240 minutes | Weekdays, 08:00–17:00; emergency areas operate continuously | 3–7 | 1,600–4,000 | 2.0%–2.5% | Waiting rooms, outpatient entrances, cafeterias, and visitor lounges | Medium | Patients and visitors may need reliable communication during lengthy waits, but placement must comply with facility safety and operating policies. |
| Hotels and Convention Centers | 20,000–80,000 | 180–720 minutes | Check-in periods, conferences, weekends, and event schedules | 2–5 | 1,200–4,500 | 3.0%–5.0% | Lobby, reception area, conference registration, and lounge spaces | Medium | Guests and delegates often spend extended periods onsite and require charging for navigation, digital tickets, communication, and business activities. |
| Large Office Complexes | 30,000–120,000 | 180–480 minutes | Weekdays, 08:00–18:00 | 2–5 | 900–3,000 | 2.0%–3.0% | Reception areas, shared workspaces, cafeterias, and visitor entrances | Medium | Stable weekday traffic provides predictable demand, particularly in buildings with visitors, flexible workers, and shared amenities. |



 08045479132

 Send Inquiry


 Send Inquiry
 Send SMS