2026 Best Thermal Bond Non Woven Suppliers?
thermal bond non woven materials are moving from simple commodity roles toward engineered performance solutions. Their fibers are bonded with heat, not chemical binders, creating fabrics that can feel dry, spring back after compression, and maintain stable thickness. These details matter in filtration, hygiene, automotive interiors, furniture, and protective packaging.
Smithers’ market report, The Future of Global Nonwovens to 2029, identifies hygiene, filtration, transportation, and construction as important demand sectors. Grand View Research also reports continued expansion in the global nonwoven fabrics market, supported by lightweight materials, process efficiency, and rising product customization. However, published forecasts use different definitions. Their numbers should not be treated as identical.
Dr. Behnam Pourdeyhimi, Executive Director of The Nonwovens Institute, has said, “Nonwovens are everywhere.” That observation is simple, but useful. A capable supplier must control fiber selection, web formation, bonding temperature, basis weight, and roll consistency. Small variations can appear as weak edges, uneven loft, or poor air permeability.
This 2026 supplier guide will examine manufacturers through practical evidence, including production capability, testing systems, customization experience, certifications, lead times, and customer support. Factory scale alone proves little. A glossy website proves less.
No ranking is perfect. Regional logistics, raw-material changes, and application requirements can alter the best choice. Buyers should request current technical data sheets, sample rolls, test results, and clear tolerances before signing a contract. The strongest Thermal Bond Non Woven supplier is not always the largest. It is the one that can repeatedly deliver the required fabric, under real production conditions.
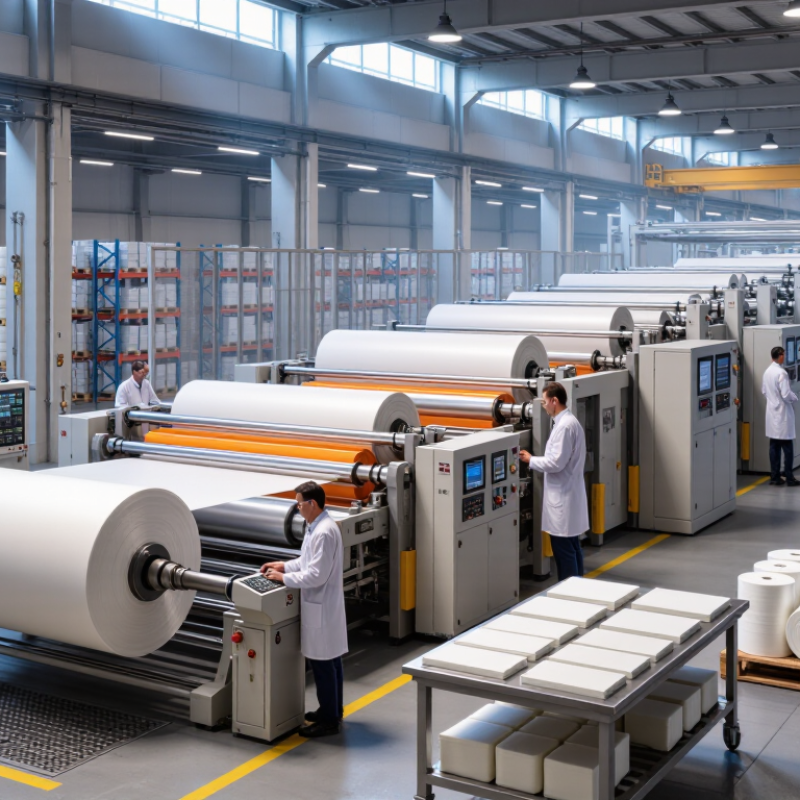
Define Thermal-Bond Nonwovens: Fiber Types, Web Formation, and 110–180°C Bonding
Thermal-bond nonwovens are made by joining thermoplastic fibers with controlled heat, pressure, or both. Unlike resin-bonded materials, they need no liquid adhesive. Common fiber choices include polypropylene, polyester, polyethylene, and bicomponent fibers. Bicomponent fibers are especially practical. Their outer sheath melts first, while the inner core preserves strength.
Web formation controls the final structure. Carding creates an oriented web with visible fiber direction. Airlaid production gives a more random arrangement and can improve bulk. Spunbond systems form continuous filaments directly, often producing uniform rolls at high speed. Operators should check fiber fineness, web weight, moisture, and fiber distribution before bonding. Small variations can create weak spots.
Bonding commonly occurs between 110 and 180°C, but this range is not a universal recipe. The correct setting depends on polymer chemistry, sheath composition, dwell time, pressure, and web speed. Excess heat may flatten the web, reduce softness, or damage pore structure. Insufficient heat can cause linting and poor tensile strength. Differential scanning calorimetry, peel testing, air-permeability checks, and visual inspection provide useful evidence when evaluating a supplier. The 110–180°C range sounds precise, yet it can mislead. A reliable producer should explain the actual bonding window, not merely quote one temperature. Supplier claims still need production trials.
Compare Supplier Capacity Across 15–200 g/m² Basis Weights and Roll Widths
2026 Best Thermal Bond Non Woven Suppliers?
Comparing supplier capacity across 15–200 g/m² basis weights requires more than checking a catalog. A reliable supplier should show stable production data at both extremes. At 15 g/m², small process changes can affect openness, strength, and roll handling. At 200 g/m², heat penetration and bonding uniformity become more demanding. Ask for recent test reports, not only standard specifications.
Roll width is equally important. A supplier may produce narrow trial rolls but lack equipment for wider production runs. Confirm the minimum and maximum widths, winding direction, core size, roll diameter, and edge tolerance. These details affect cutting waste and machine loading. Request samples from several weights, such as 25, 60, 100, and 180 g/m². Compare thickness, tensile strength, elongation, air permeability, and visual consistency.
Capacity should also include practical flexibility. Can the supplier repeat the same weight after three months? Can it manage small pilot orders without disrupting delivery schedules? Production claims sometimes look stronger than actual output. I would inspect batch records and ask how rejected rolls are handled. That step may feel slow. It often reveals more than a polished factory presentation. Suppliers with documented calibration, traceable raw materials, and clear inspection routines usually provide safer long-term performance. Still, no supplier is perfect; humidity, fiber variation, and setup time can change results between batches.
2026 Best Thermal Bond Non Woven Suppliers? - Compare Supplier Capacity Across 15–200 g/m² Basis Weights and Roll Widths
Anonymous supplier-capacity comparison for thermal-bonded nonwoven production. Monthly output is shown in metric tonnes under normal commercial operating conditions.
| Supplier Profile | Typical Line Configuration | Basis Weight
(g/m²) | Estimated Usable Capacity by Finished Roll Width
(metric tonnes per month) |
| 1.0 m | 1.6 m | 2.0 m | 2.5 m | 3.2 m |
Profile 1
Compact Producer | Single thermal-bond line
Maximum practical width: 1.6 m | 15 | 92 | 145 | — | — | — |
| 25 | 118 | 188 | — | — | — |
| 40 | 150 | 240 | — | — | — |
| 60 | 176 | 282 | — | — | — |
| 80 | 198 | 317 | — | — | — |
| 100 | 215 | 344 | — | — | — |
| 150 | 236 | 378 | — | — | — |
| 200 | 248 | 397 | — | — | — |
Profile 2
Mid-Width Producer | One high-output thermal-bond line
Maximum practical width: 2.4 m | 15 | 130 | 208 | 260 | — | — |
| 25 | 165 | 264 | 330 | — | — |
| 40 | 210 | 336 | 420 | — | — |
| 60 | 248 | 397 | 496 | — | — |
| 80 | 278 | 445 | 556 | — | — |
| 100 | 300 | 480 | 600 | — | — |
| 150 | 329 | 526 | 658 | — | — |
| 200 | 345 | 552 | 690 | — | — |
Profile 3
Wide-Web Producer | Wide thermal-bond line with automatic winding
Maximum practical width: 3.2 m | 15 | 158 | 253 | 316 | 395 | 506 |
| 25 | 201 | 322 | 402 | 503 | 644 |
| 40 | 257 | 411 | 514 | 643 | 822 |
| 60 | 302 | 483 | 604 | 755 | 966 |
| 80 | 337 | 539 | 674 | 843 | 1,078 |
| 100 | 365 | 584 | 730 | 913 | 1,168 |
| 150 | 400 | 640 | 800 | 1,000 | 1,280 |
| 200 | 420 | 672 | 840 | 1,050 | 1,344 |
Profile 4
Multi-Line Producer | Multiple thermal-bond lines with shared finishing
Maximum practical width: 3.2 m | 15 | 245 | 392 | 490 | 613 | 784 |
| 25 | 312 | 499 | 624 | 780 | 998 |
| 40 | 398 | 637 | 796 | 995 | 1,274 |
| 60 | 468 | 749 | 936 | 1,170 | 1,498 |
| 80 | 523 | 837 | 1,046 | 1,308 | 1,674 |
| 100 | 567 | 907 | 1,134 | 1,418 | 1,814 |
| 150 | 621 | 994 | 1,242 | 1,553 | 1,987 |
| 200 | 653 | 1,045 | 1,306 | 1,633 | 2,090 |
Profile 5
Specialty-Focused Producer | Flexible line optimized for low-to-medium weights
Maximum practical width: 2.0 m | 15 | 110 | 176 | 220 | — | — |
| 25 | 142 | 227 | 284 | — | — |
| 40 | 181 | 290 | 362 | — | — |
| 60 | 208 | 333 | 416 | — | — |
| 80 | 226 | 362 | 452 | — | — |
| 100 | 238 | 381 | 476 | — | — |
| 150 | 246 | 394 | 492 | — | — |
| 200 | 252 | 403 | 504 | — | — |
Notes: Capacity figures are planning benchmarks for thermal-bonded nonwoven lines using common synthetic staple-fiber constructions. Actual output varies with fiber blend, bonding temperature, web uniformity, line speed, trim loss, winding format, preventive maintenance, and order mix. “—” indicates that the stated roll width is outside the profile’s practical finishing range. Width values refer to finished roll width rather than machine deckle width.
Assess Product Quality Using ISO 9073-3, ISO 9073-4, and ASTM D5035
2026 Best Thermal Bond Non Woven Suppliers?
A reliable assessment starts with controlled samples, not attractive photographs. For thermal bond nonwoven, record basis weight, thickness, fiber blend, bonding temperature, and production direction. Condition specimens before testing. Moisture and temperature can change elongation noticeably.
ISO 9073-3 measures tensile strength and elongation of nonwoven fabrics. Test both machine direction and cross direction. Watch the force curve, not only the final number. A strong peak with early necking may indicate uneven bonding.
ISO 9073-4 evaluates tear resistance, revealing how a small cut spreads through the web. This matters for packaging, filtration, and protective layers.
ASTM D5035 uses the strip method to measure breaking force and elongation in textile materials. Confirm specimen width, jaw separation, gripping pressure, and test speed before comparing reports. Small setup differences can create large disagreements.
Ask suppliers for dated laboratory reports, conditioning details, specimen dimensions, and failure descriptions. Request results from several production lots, not one perfect batch. Compare averages and variation. I have found that a neat table can hide weak edge samples. That is easy to miss. Retesting suspicious results is sensible, even when the supplier seems technically capable. Independent verification adds confidence, but it does not replace clear manufacturing records. A credible supplier should explain abnormal breaks without defensive language. Real quality is visible in repeatability, traceability, and honest limitations.



 08045479132
 Send Inquiry

 Send Inquiry
 Send SMS